Esp32 jtag debugger with Sloeber
This is a step by step instruction to setup Sloeber “The Eclipse Arduino Ide” with OpenOcd and a FTDI 2232HL as debugger. With this you can debug your Arduino sketch real time on an Espressif ESP32 in circuit with jtag.
As hardware for the debugger I used 2232HL board from Ali-express , this one was around $14. However every board with a FTDI 2232hl will work.
The 2232HL is a 3.3V device so don’t connect to 5V hardware or else the smoke will escape and the 2232HL will stop working.
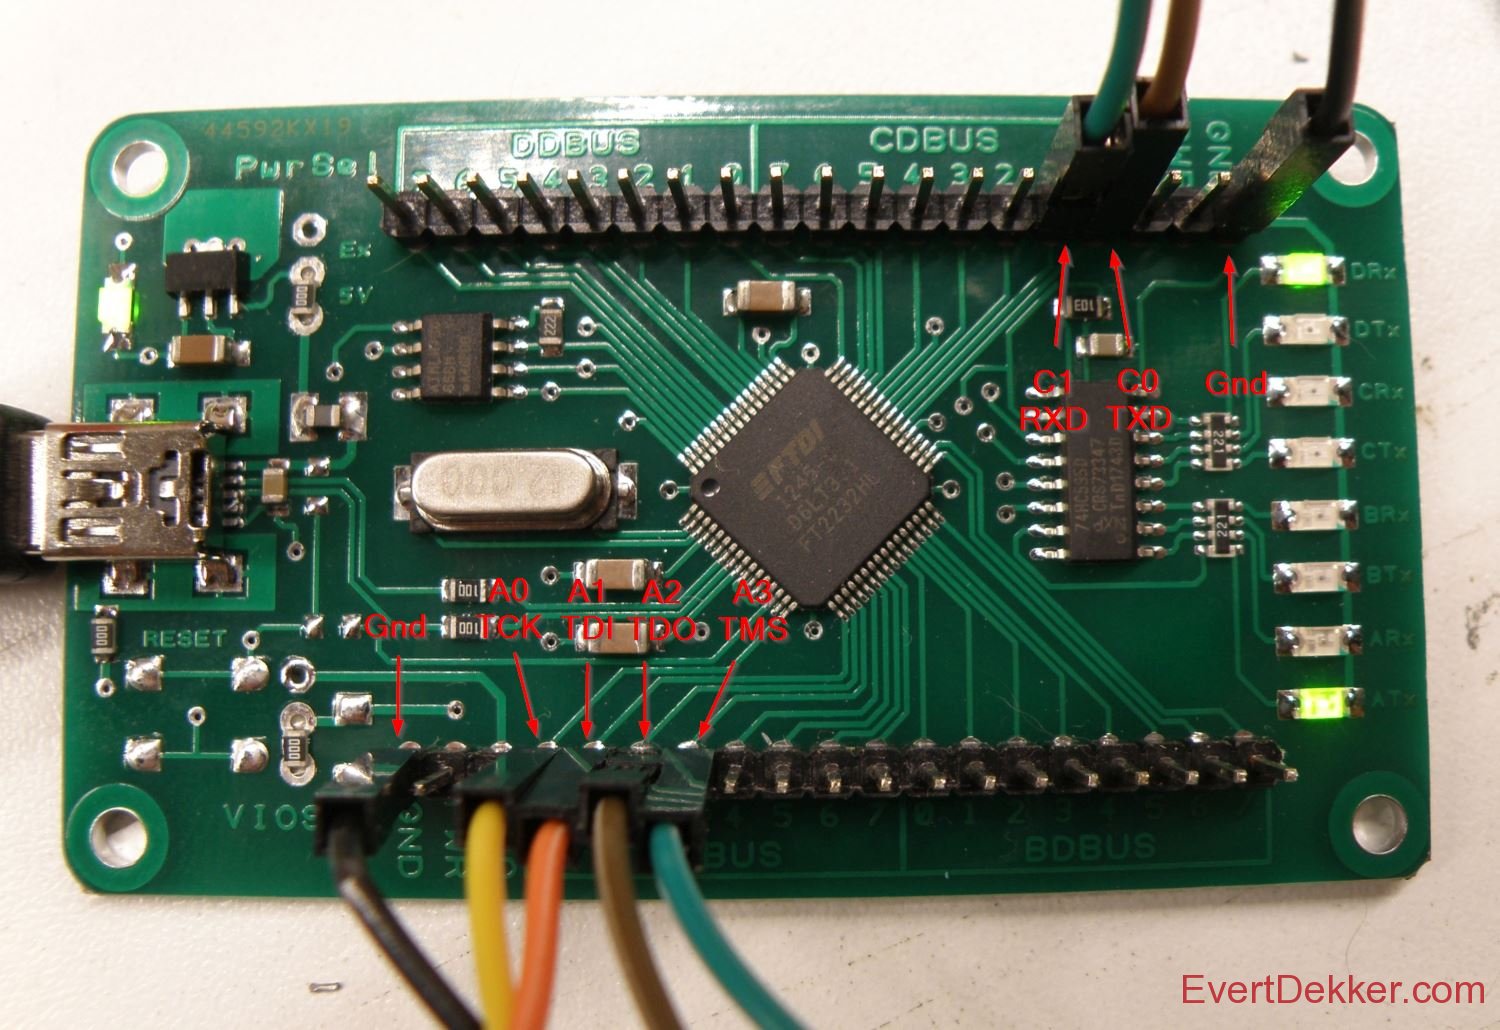
You need to connect it like this to your hardware:
AD0 – TCK (Gpio13)
AD1 – TDI (Gpio12)
AD2 – TDO (Gpio15)
AD3 – TMS (Gpio14)
GND – GND
Optional serial port:
CD0 – TXD (Gpio3)
CD1 – RXD (Gpio1)
Installing Sloeber “The Eclipse Arduino Ide”
- Download Sloeber
- Extract the gz to the directory of your choice, in this tutorial we use c:\sloeber
- Let’s setup some basic stuff for Sloeber.
- Arduino -> Preference -> platform and boards
- Check Arduino AVR boards and esp8266 2.4.2 (or newer) both are not really necessary for the esp32, but it’s nice to have some samples and libraries.
Installing Esp32 Arduino and Sdk
- In Sloeber File -> Import -> Projects from git -> Clone URI and copy the url https://github.com/espressif/arduino-esp32.git in the URI field.
- Press next and uncheck all the branches except master, press next again.
- Change the directory to C:\sloeber\arduino-esp32 and press next again.
- Choose Import as general project and press next again.
- Let’s add it to the ide, Arduino -> Preferences -> Platforms and boards
- Press the new button next to the Private hardware path and enter C:\sloeber\arduino-esp32 in the path box.
- Press Apply and close
- Now we need to download the Esp32 sdk, browse with windows to C:\sloeber\arduino-esp32\tools and click on get.exe
- Done
Replace the FTDI by Winusb driver
- Download Zadig , no need to install just run it.
- Click Options -> List All devices
- Choose in the dropdownbox USB <-> Serial Convertor (interface 0).Be careful here that you select the correct device.
- Choose the WinUSB (V6.1.xxxx.xxxxx) driver and press the Install driver button
Note: For some reason sometimes (win update?, other usb port) windows will roll back to the original FTDI driver and you have to do this again.
Installing OpenOcd
- Download OpenOcd for the Esp32 from Github (I have used 0.10.0 20180920 version)
- Extract the content to C:\Sloeber\Openocd
- Download the cfg file for the debugger and place it in C:\sloeber\openocd-esp32\share\openocd\scripts\interface\ftdi
Note: this file is for the Ftdi 2232HL based debugger that I have. For other debugger look in the C:\sloeber\openocd-esp32\share\openocd\scripts\interface directory. This cfg file can work with other Ftdi based hardware, but I can’t guaranty nor support that.

- Connect your debugger to the Esp32 hardware and let’s see if it works by typing on the command line: C:\sloeber\openocd-esp32\bin\openocd.exe –f c:\sloeber\openocd-esp32\share\openocd\scripts\interface\ftdi\quantum.cfg

- If you get something as in the picture above with the “device found …..Tensilica” in it you rock. The hardware and OpenOcd are working
Setting up a new sketch
- Lets start a new project, Arduino -> new sketch, give the project a name and press next
- Platform holder c:/sloeber/arduino-esp32 , fill in the rest with the board etc you have. Port is the comport your board is connected to, not the jtag. Press next

- Choose Sample sketch -> example -> 01.basics and check blink. Press finish
- We need to set some build options for the debugger, right click on your project map, Arduino -> tab compile options and enter in the append to C and C++ field -ggdb -Og. These compiler options are not needed for a production version.
- Let’s compile, press Arduino -> verify
- And upload it to your board Arduino -> upload sketch. If you have a led connected to the pin as defined in the sketch is should blink now.
Setting up the debugger in Sloeber
- Right click in the project explorer window on your project and choose Debug as -> Debug configurations.
- Choose GDB openOCD debugging and add a new configuration by clicking on the + at the left upper corner.
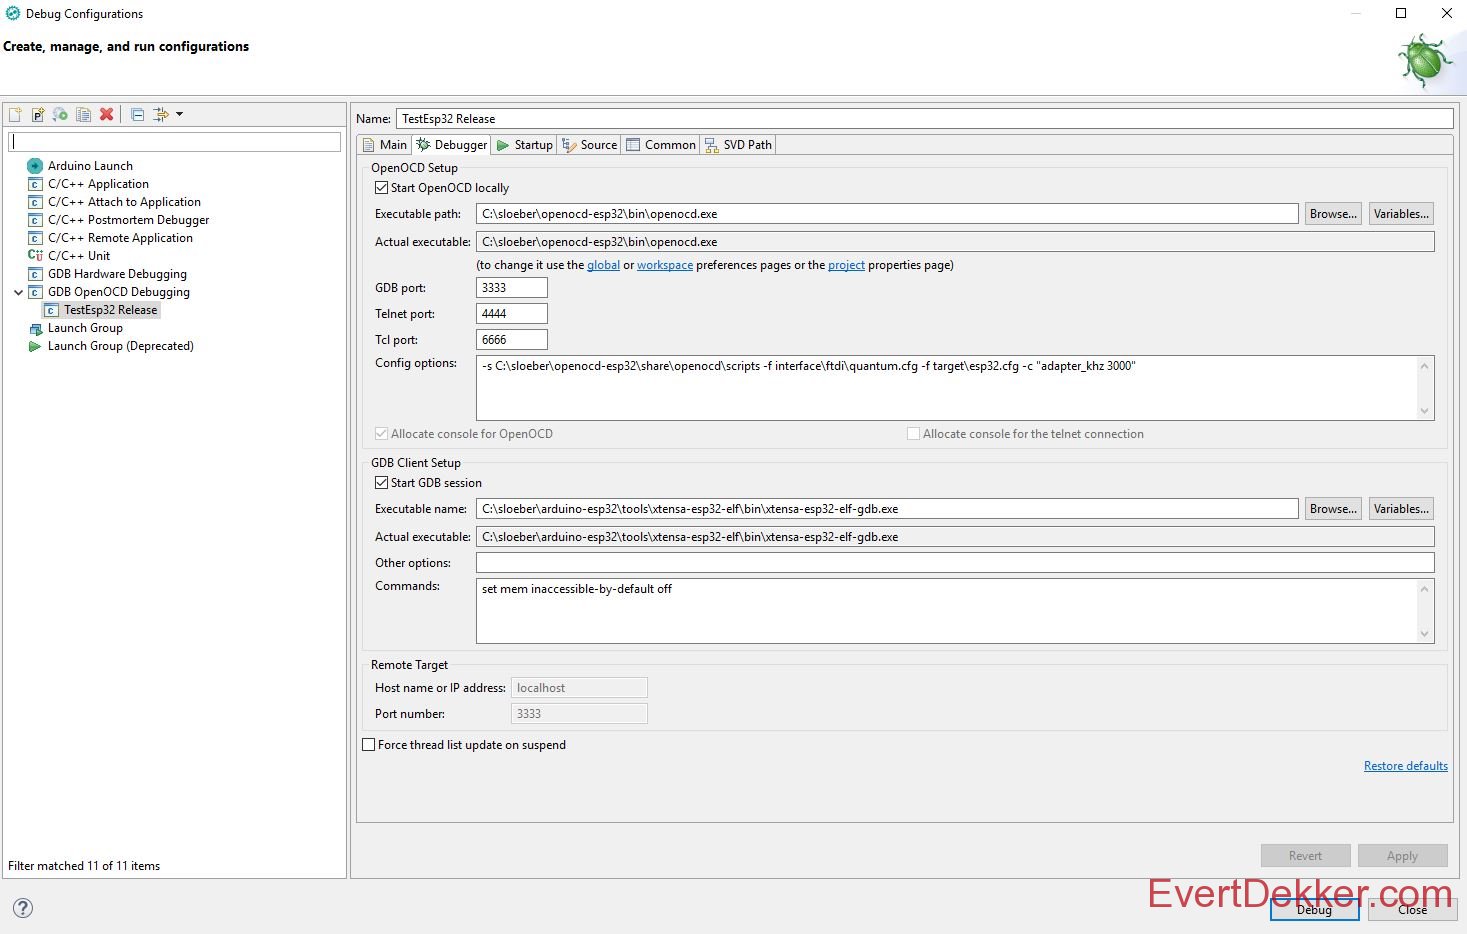
- On the debugger tab check Start OpenOCD locally
- Executable path will be C:\sloeber\openocd-esp32\bin\openocd.exe
- GDB port: 3333
- Add to Config options -s C:\sloeber\openocd-esp32\share\openocd\scripts -f interface\ftdi\quantum.cfg -f target\esp32.cfg -c “adapter_khz 3000”
- Check Start GDB session
- Executable name for the GDB client will be C:\sloeber\arduino-esp32\tools\xtensa-esp32-elf\bin\xtensa-esp32-elf-gdb.exe
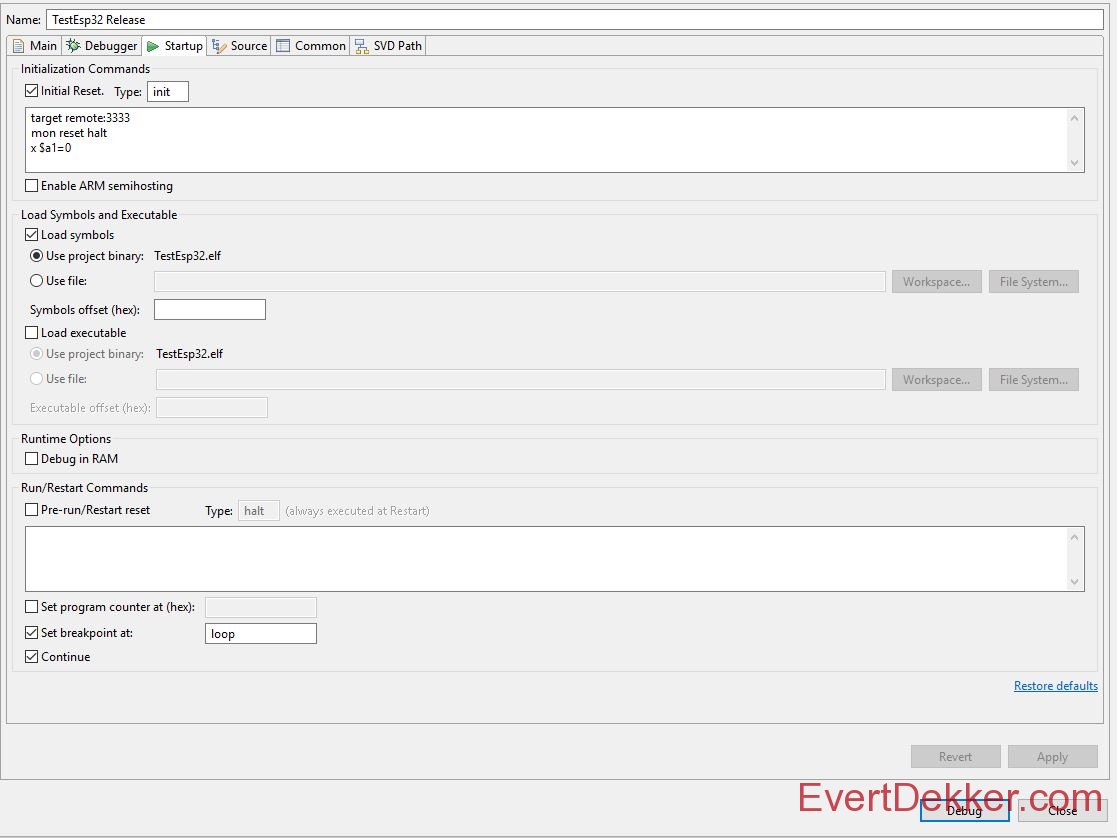
- Select the Startup tab and set these settings
- Check Initial reset, Type: init
- In the command box enter:
target remote:3333
mon reset halt
x $a1=0 - Uncheck Enable ARM semihosting
- Check load symbols, use project binary should be already have your project name
- Uncheck Load executable, debug in ram, Pre-run, Set program counter at (hex)
- Set the checkbox Set breakpoint at and fill in textbox loop
- Check Continue

- Press the Debug button and there you go
You can also program the ESP32 automatic with the jtag before debugging, add in the command box as described in step 61. below the target remote:3333 line
monitor program_esp32 c:/users/evert/Documents/sloeber-workspace/Testesp32/release/Testesp32.bin 0x10000 verify
Note: It was not possible to use in the command box Eclipse variable like {project_loc}, this would be handy so you don’t have to change every project the hard coded path. These variable like {project_loc} contains backslash “\” and GDB expects forward slash”/”. I did a lot of Google reading but couldn’t find a solution, if you have one let me know.
How to use it?
It’s a bit out of scope of this tutorial how to describe full the debug function in Sloeber. Because Sloeber is based on Eclipse there is enough videos etc available to help you out.
To start a debug session you have to Right click your project -> Debug As -> Debug configuration and press debug. Sloeber will then switch to the debug perspective
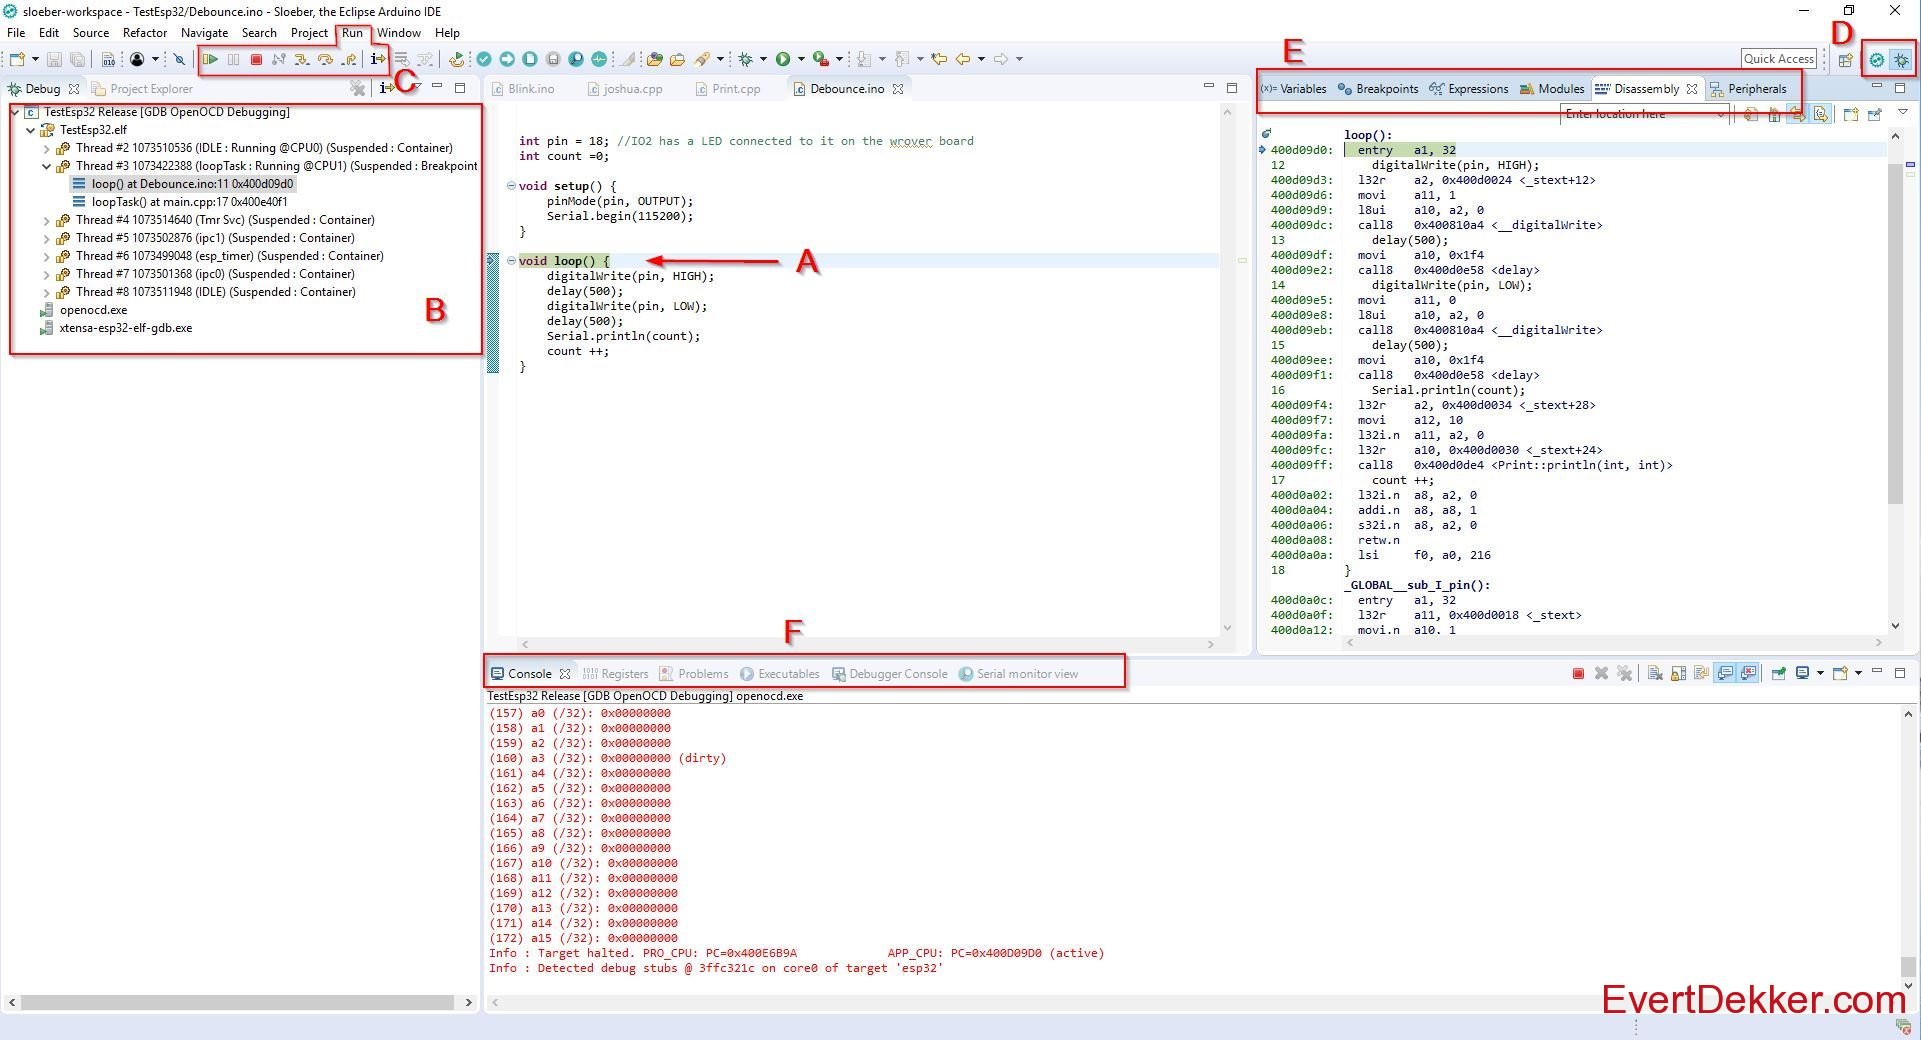
As a quick reference have a look at this:
- Program code window, program is paused at loop(), this because we set this in step 65.
- Thread window, here you can see all the threads that are running on the Esp32.
- Control buttons, with these you can start, pause, stop and step in various ways trough your code.
- Perspective view, you can switch between code and debug perspective
- Various windows to see and influence variable, breakpoints etc. Peripherals is unfortunately not working yet.
- Some more windows here, cpu registers and Serial monitor view are the most used.
Note: If you copy the settings direct from this page watch out that punctuation marks like “ and ‘ are not copied correct (they have an other, wrong ascii value) and will give problems or error’s. Just retype them and it should work fine.

